

Every fall, the National Fire Protection Association (NFPA) releases a report containing a rundown of the previous year’s fire loss in the U.S. Gathered through surveying just over 2,000 public fire departments across the country, the annual report was published in September to provide a snapshot of fire loss today. Here are some of the findings from this year’s report:
- Fire departments responded to 1,318,500 fires, which is about 1,000 fewer than in 2017.
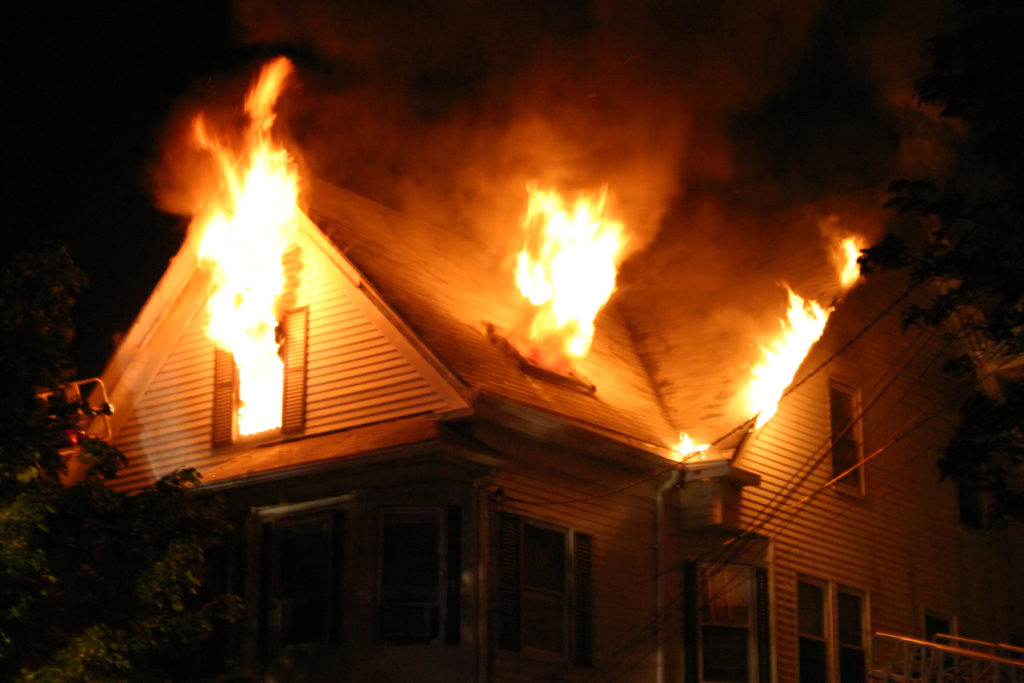
- About 499,000 of those fires occurred in structures (both residential and non-residential), roughly the same number as in 2017.
- Every 24 seconds, a U.S. fire department responded to a fire. A structure fire occurred about every 63 seconds, and a home fire occurred roughly every 87 seconds.
- In an 8% increase from 2017, fires resulted in about 3,655 civilian deaths last year. NFPA notes that this number is driven partially by the “Camp Fire”, a Northern California wildfire that killed 86 people.
- Fires last year caused $25.6 billion in property damage, an 11% increase over the previous year; this includes $12 billion in direct property damage from the major wildfires in Northern California.
- About 25,000 structure fires were intentionally set, a 13% increase from 2017.
Deaths and Injuries
Until recent years, the number of home fire deaths has trended downward (since the 1978 peak of 6,015 people). That number has remained below 3,000 since 2006. The death rate per 1,000 home fires, however, which was 8.1 in 1977, reached its lowest number of 6.5 in 2006, and climbed to 7.5 in 2018. According to NFPA, this indicates that while the number of home fires and home fire deaths have declined over the past 40 years, the risk of dying in a home blaze severe enough for the fire department to be called has not seen a significant decrease during that time.
An estimated 15,200 civilian injuries occurred in 2018, an increase of about 4% over the previous year. Not all injuries are reported to fire departments, though, so actual numbers may be higher than what the survey reveals.
Wildfires
While the number of structure fires has drastically decreased in the past 40 years — from 1,098,000 in 1977 to 499,000 in 2018 — the number of wildfires, their duration, and the amount of damage they cause have climbed in recent years.
According to the Insurance Information Institute, six of the top 10 costliest wildfires in the U.S. occurred in 2017 or 2018, all of which were in California. Shorter winters and longer, dryer summers contribute to wildfire season that can now last up to eight months in some parts of the country. As a result, agencies are adapting by increasing the number of wildland firefighters and conducting training for year-round fires.
By the Numbers
While the NFPA’s annual report provides an important overview, there’s much more to the overall fire loss picture. The dedicated researchers in NFPA’s Research, Data and Analytics Division also released a report revealing greater detail, such as patterns related to locality, the number of fire department responses by type of call, and a more comprehensive breakdown of how they conducted the survey.
Other reports published by the NFPA include the following:
- Brush, Grass, and Forest Fires
- Home Cooking Fires
- U.S. Fire Department Profile
- Home Structure Fires
- Structure Fires Started by Hot Work