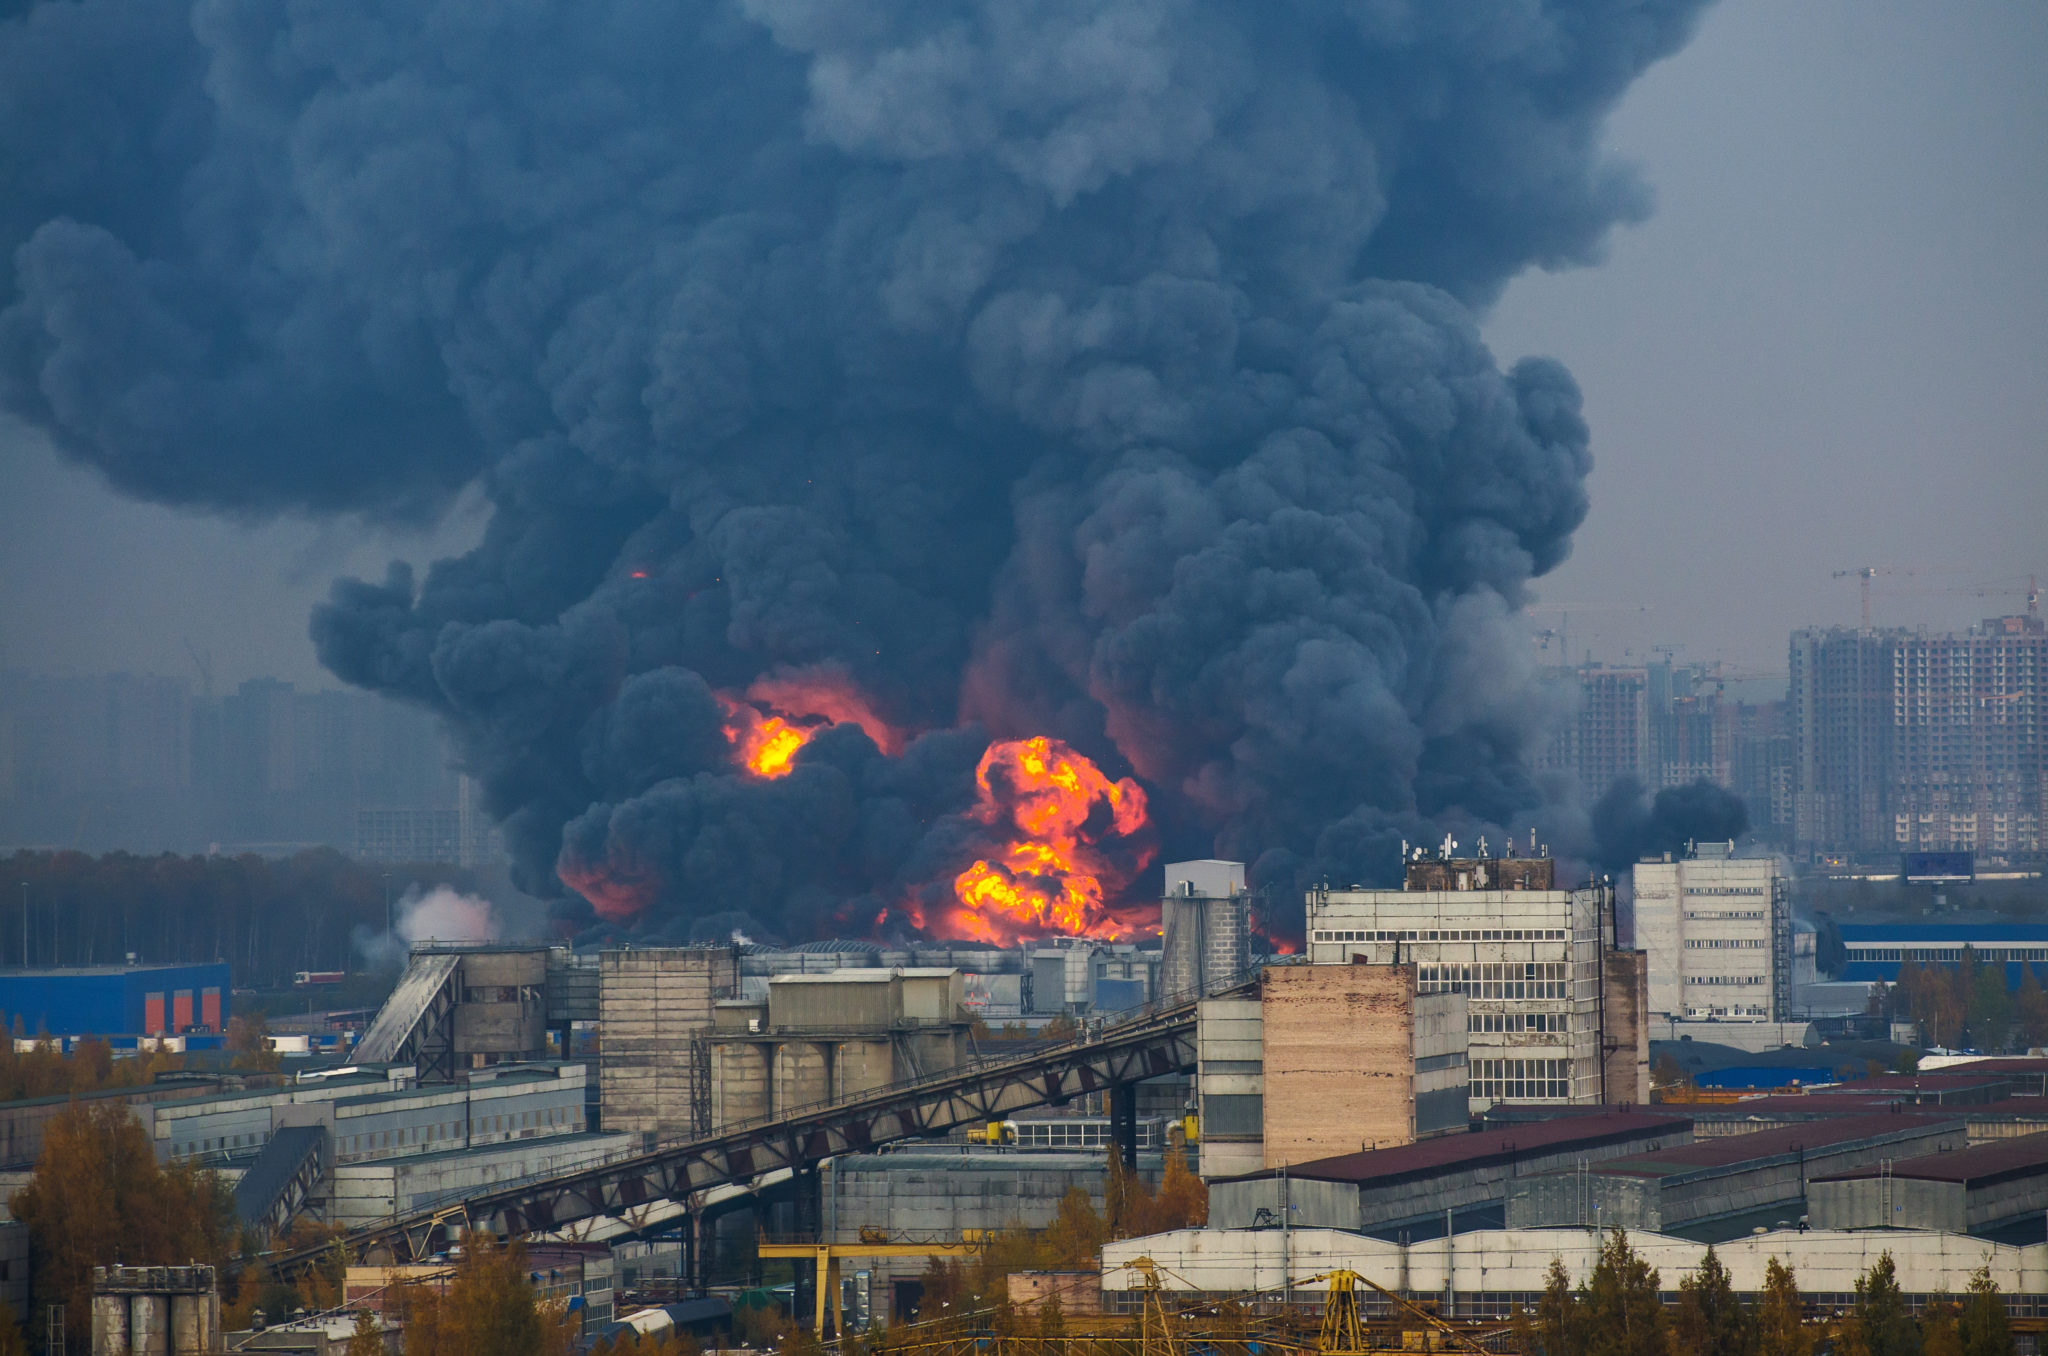
 By Friday, October 13, more than 3,500 homes and businesses across Northern California wine country had been destroyed and 31 people had died in the deadliest week for wildfires in California’s history. As we continue to think about those affected in California and hope for rain and an end to the devastation, let’s take a look back at the stats on last year’s fire loss.
Every fall the National Fire Protection Association (NFPA) surveys a sample of fire departments in the U.S. and uses the information to estimate the country’s fire loss in a published report. Here are some figures you should know:
Overall
1,342,000: Fires reported by fire departments in 2016
3,390: Civilian deaths—the highest number of fatalities in eight years
$10.6 billion: Property damage
20,000: Intentionally set structure fires—a 13% decrease from 2015
Structure Fires
The NFPA categorizes structure fires as residential and non-residential. Residential structures include single- and two-family homes, multi-family buildings, apartments, hotels, dormitories, and boarding houses. Non-residential structures include schools, health care institutions, stores and offices, storage facilities, industrial buildings, and correctional institutions, plus other structures like bridges.
475,500: Structure fires—5.2% fewer than 2015 and the lowest since the NFPA began collecting data in 1977 (when that number was 1,098,000)
371,500: Residential structure fires—this makes up about 78.1% of all structure fires (a decrease of 16,500 from the previous year )
104,000: Non-residential structure fires (decrease of 8.4% from 2015)
Non-Structure Fires
The number of outside or other non-structure fires has been below 1 million since the 1980s.
662,500: Outside and other non-structure, non-vehicle fires—nearly half of all reported fires, at 49.3%—a 3.6% increase
298,500: Brush, grass, and forest fires
172,000: Outside rubbish fires
88,000: Outside fires involving property of value
173,000: Highway vehicle fires
Civilian Deaths
The number of civilian home fire deaths peaked in 1978, when 6,015 people died in home fires. That number has decreased consistently over the years until recently, and since 2006 there have been fewer than 3,000 home fire deaths each year.
3,390: Civilian deaths—an increase of 3.4% from 2015 and the highest number since 2007
2,735: Civilian deaths caused by home structure fires
65: Civilian fire deaths in other residential buildings like hotels, dormitories, and boarding houses
150: Civilian deaths in non-residential structural fire—an increase of 87.5%, largely due to a warehouse fire in Oakland, CA, where 36 civilians died
310: Number of intentionally-set fires that resulted in civilian deaths
Property Loss
The NFPA points out that the impact of occasional large-loss fires can make property loss totals vary dramatically from one year to the next.
$10.6 billion: Property loss—a 25.7% decrease from the previous year
$7.9 billion: Property damage in structure fires not related to wildfires—a decrease of 23.2% from 2015
$5.7 billion: Property loss in home structures
$16,610: Average property loss in structure fires
For a much more detailed look at the country’s 2016 fire loss, download the full report here.

